Sea level explained
Learn about sea-level rise with our videos and illustrations: what are the main key drivers of global and regional sea level change?
Global sea level changes
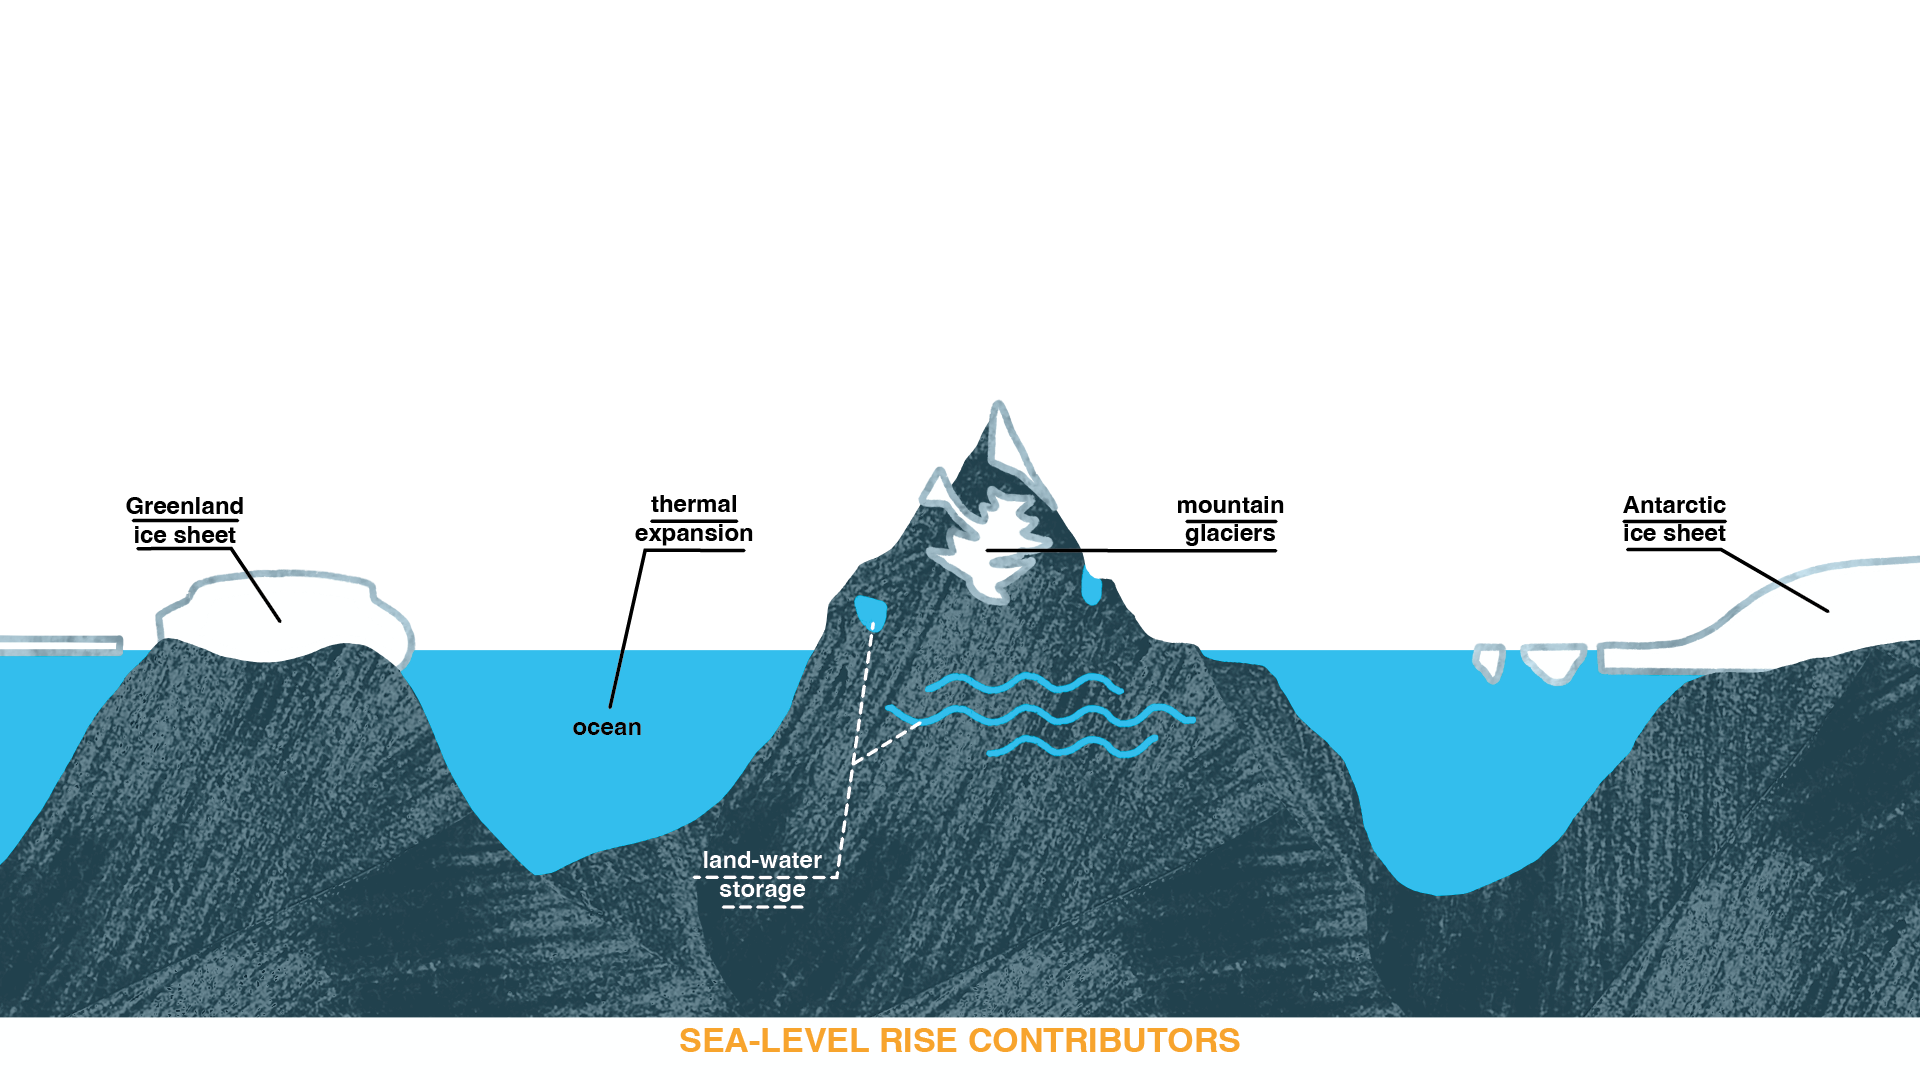
“Sea level change arises from processes acting on a range of spatial and temporal scales, in the ocean, cryosphere, solid Earth, atmosphere and on land” (Box 9.1 IPCC 2021). Below are the main contributors.
Sea level science episode 1 - how can we predict sea level rise in the future?

Protect Sealevelrise

The Antarctic ice sheet
The Antarctic ice sheet is “an ice body [covering the continent of Antarctica] [...] that has formed over thousands of years through accumulation and compaction of snow. It [...] flows outward from a high central ice plateau with a small average surface slope. The margins usually slope more steeply, and most ice is discharged through fast-flowing ice streams or outlet glaciers, often into the sea or into ice shelves floating on the sea.” (IPCC, 2021)
The Greenland and Antarctic ice sheets are the largest reservoirs of frozen freshwater and therefore potentially the largest contributors to sea level rise. Fluctuations in ice-sheet volume arise from the imbalance between accumulation (either at the ice-sheet surface or on the underside of ice shelves) and loss from sublimation, surface and basal melting, and iceberg calving.” (IPCC, 2021)
Antarctica, a game changer for sea level rise

Protect Sealevelrise
Two processes are critical for the stability and potential rapid loss of ice sheets, significantly impacting sea-level rise: MISI (Marine Ice Sheet Instability) and MICI (Marine Ice Cliff Instability). Both of these processes are triggered in the “High end scenario”
Marine ice cliff instability (MICI) A hypothetical mechanism of an ice cliff failure. In case a marine-terminated ice sheet loses its buttressing ice shelf, an ice cliff can be exposed. If the exposed ice cliff is tall enough (about 800 m of the total height, or about 100 m of the above-water part), the stresses at the cliff face exceed the strength of the ice, and the cliff fails structurally in repeated calving events. (IPCC, 2021)
Marine ice sheet instability (MISI) A mechanism of irreversible (on the decadal to centennial time scale) retreat of a grounding line for the marine-terminating glaciers, in case the glacier bed slopes towards the ice sheet interior. (IPCC, 2021)

The Greenland ice sheet
The Greenland ice sheet is “an ice body [...] that has formed over thousands of years through accumulation and compaction of snow. It [...] flows outward from a high central ice plateau with a small average surface slope. The margins usually slope more steeply, and most ice is discharged through fast-flowing ice streams or outlet glaciers, often into the sea or into ice shelves floating on the sea.” (IPCC, 2021)
“The Greenland and Antarctic ice sheets are the largest reservoirs of frozen freshwater and therefore potentially the largest contributors to sea level rise. Fluctuations in ice-sheet volume arise from the imbalance between accumulation (either at the ice-sheet surface or on the underside of ice shelves) and loss from sublimation, surface and basal melting, and iceberg calving.” (IPCC, 2021)
Exploring the Vulnerability of the Greenland Ice Sheet

Protect Sealevelrise
Ice loss from the Greenland ice sheet involves primarily surface and frontal melting as well as iceberg calving.

Mountain glaciers
“Glaciers contribute to sea level change via an imbalance between mass gain and mass loss processes, which leads to adjustments in the glacier geometry over an extended period of time, called the response time. The response time may range from a few years to a few hundred years.” (IPCC, 2021)
Vanishing glaciers: a cause of sea-level rise and a threat to water supply

Protect Sealevelrise

Thermal expansion
“Thermosteric sea level change (also referred to as ‘thermal expansion’) occurs as a result of changes in ocean temperature: increasing temperature reduces ocean density and increases the volume per unit of mass.” (IPCC, 2021)

Land-water storage
“Land-water storage includes surface water, soil moisture, groundwater storage and snow, but excludes water stored in glaciers and ice sheets. Changes in land-water storage can be caused either by direct human intervention in the water cycle (e.g., storage of water in reservoirs by building dams in rivers, groundwater extraction for consumption and irrigation, or deforestation) or by climate variations (e.g., changes in the amount of water in internally drained lakes and wetlands, the canopy, the soil, the permafrost and the snowpack).” (IPCC, 2021)
Land-water storage: water surface, snow, groundwater storage and soil moisture contribute to a small amount of sea-level change.

Regional sea level changes
This webtool presents regional mean sea-level changes due to non-uniform thermal expansion and other processes due to wind, as well as changes due to gravitational, rotational and deformational effects. Data are presented at a resolution of 1° by 1°. There are additional effects causing sea-level changes at different timescales such as local vertical land motions and coastal hydrodynamics. This webtool delivers mean sea-levels, averaged over a few years, and therefore does not consider extreme water levels due to storm surges or inter-annual variability of sea-level changes such as those linked to the El-Niño southern oscillation.
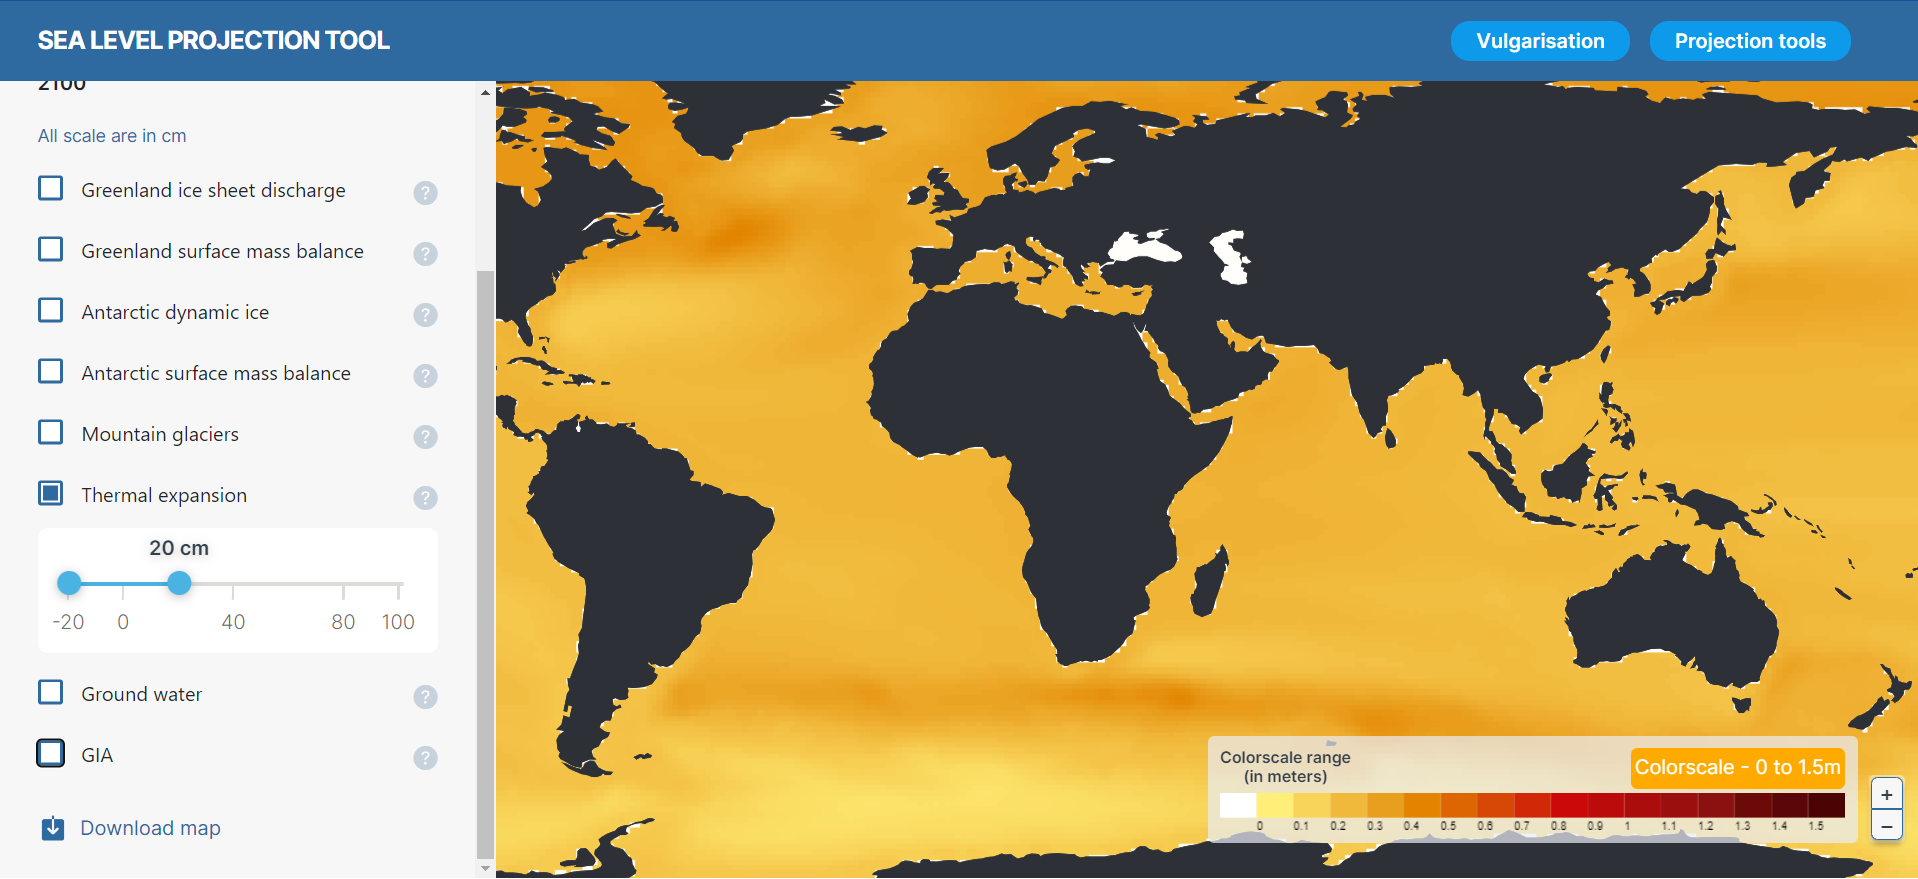
Regional impacts of the thermal expansion
Ocean warming, and therefore sea-level changes induced by ocean warming, are not uniform across the globe. They display regional variability due to changes of the ocean density and circulation, as well as due to changes in sea-level atmospheric pressures. This phenomenon is specifically referred to as “sterodynamic sea-level changes”, a term introduced by Gregory et al. (2019) (https://link.springer.com/article/10.1007/s10712-019-09525-z) and defined as “relative sea-level change due to changes in ocean density and circulation, with inverse barometer (IB) correction” or the sum of ocean dynamic sea-level change (including IB correction) and global mean thermosteric sea-level rise”.
The map below displays regional effects of this component.

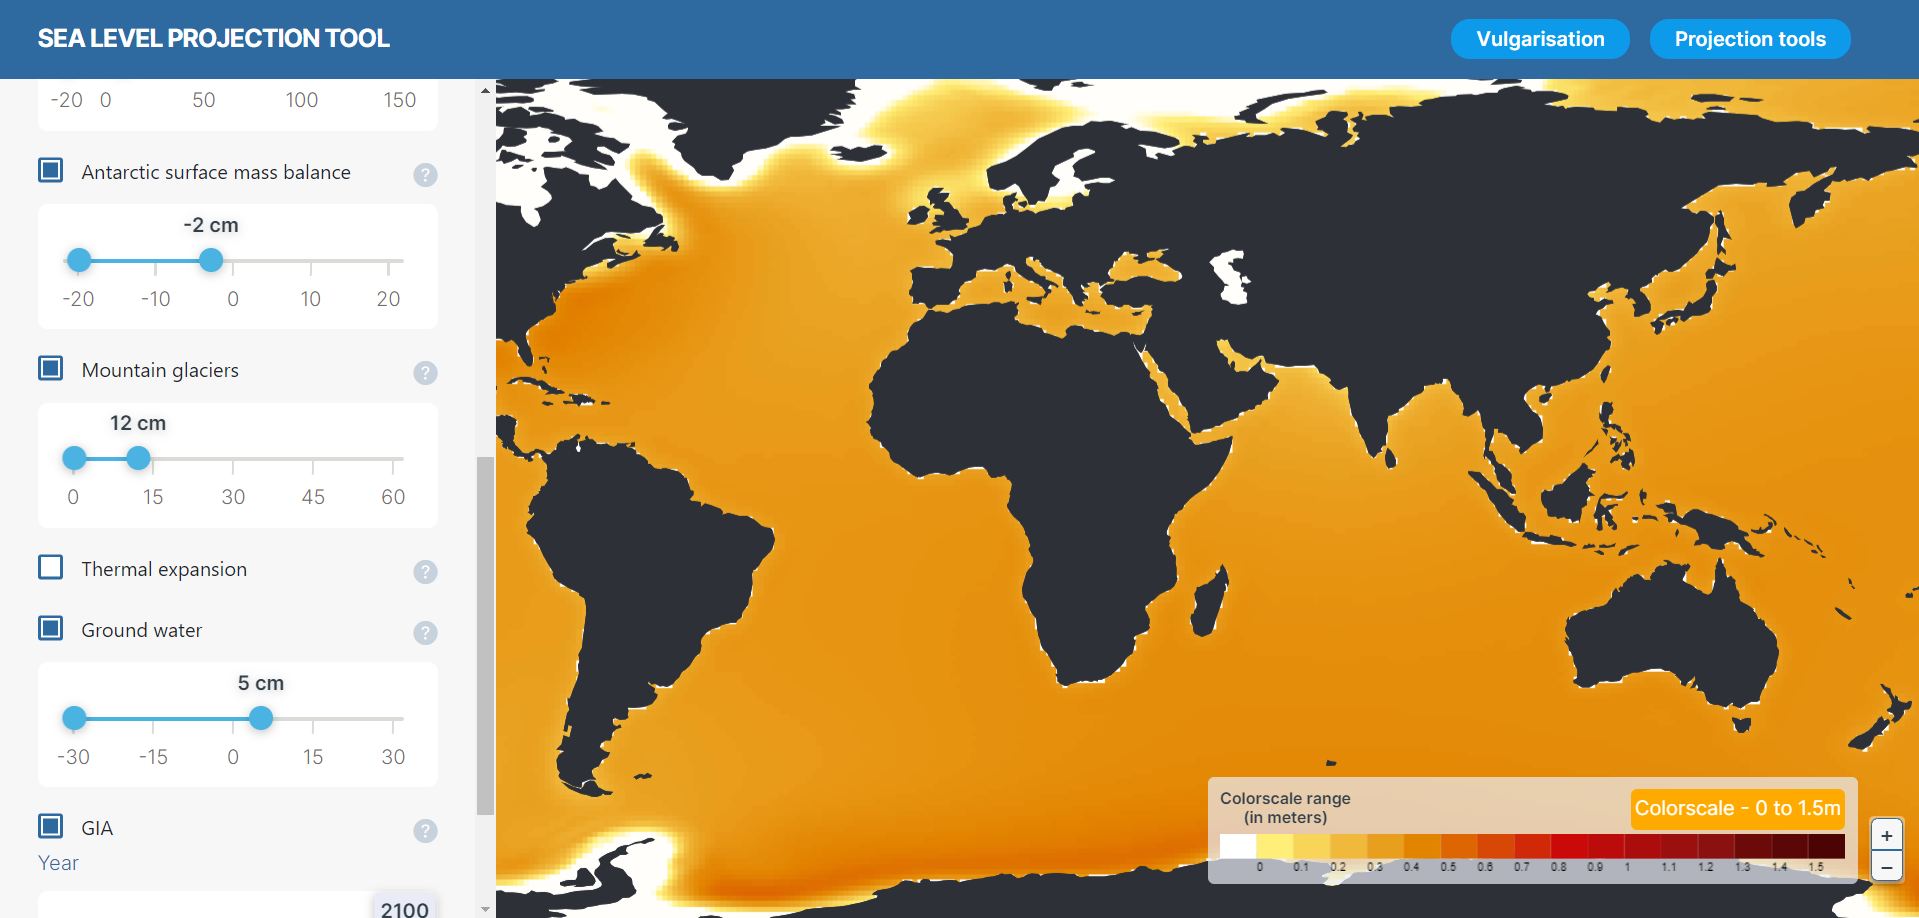
Regional impacts of ice and water mass changes
As glaciers and ice-sheets are melting and losing mass, additional water is added to the ocean. The same is true when groundwater extraction exceeds the recharge, a phenomenon that is taking place e.g. in the Indian subcontinent and in California.
This additional mass contribution to sea-level rise is not distributed uniformly across the ocean. Indeed, the mass redistributions are so large that it is altering the shape of the Earth itself. Specifically, these mass redistributions lead to gravitational, rotational and deformational changes, leading to greater-than-average mean sea-level changes in regions located far from the original source of land water or ice.
The map below displays the regional sea-level changes due to the addition of mass to the ocean.

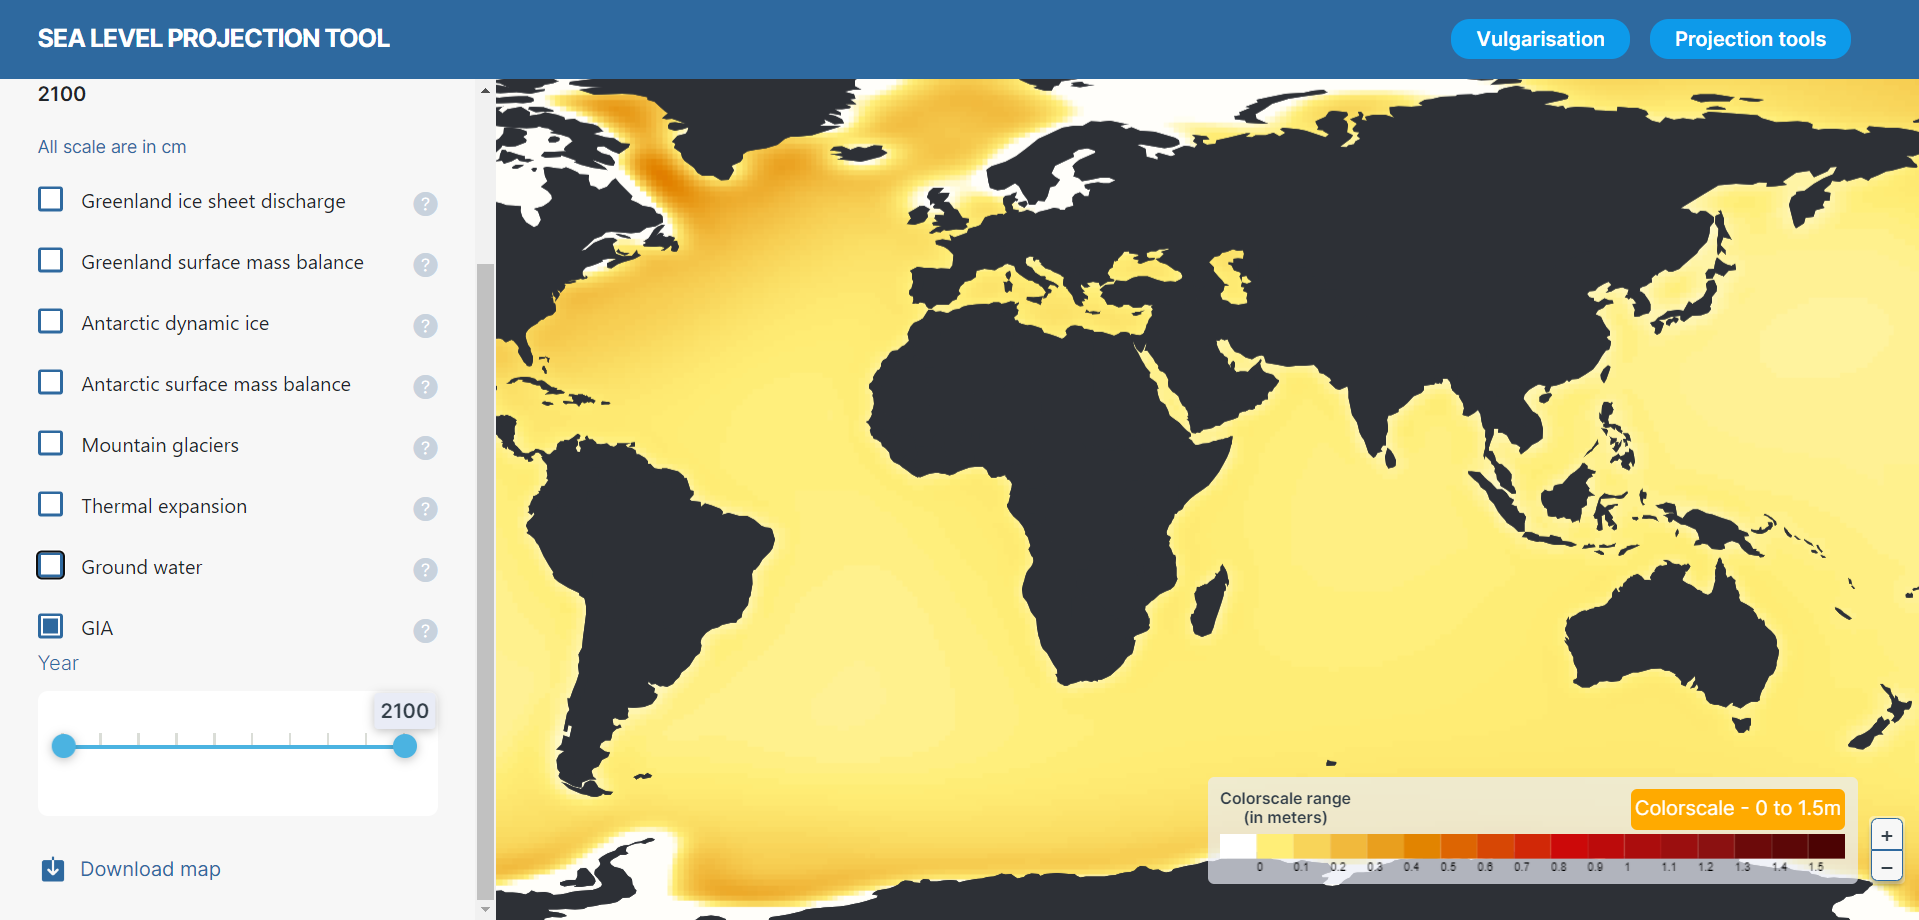
Glacial isostatic adjustment and vertical land motions
The Earth is still responding to the last deglaciation, which started 21,000 years ago. For example, the northern regions of North America and Europe that were covered by an ice-sheet at that time are still uplifting now, while other areas are subsiding such as the Chesapeake Bay in the eastern US coast.
The map below provides the projected impact of the glacial isostatic adjustment to regional mean sea-level changes by 2100.

Other vertical land motions can take place at various spatial scales, from flood plains to local areas, due to a number of natural and anthropogenic processes such as earthquakes, groundwater pumping or changes in the water contents of recent sediments deposits in delta and estuaries. These processes are not included in this webtool because they can be assessed in various ways, e.g. using tide gauge records as in the 6th Assessment Report of the IPCC, using Global navigation satellite system GNSS data, levelling data or satellite Interferometric synthetic aperture radar. These processes are typically best understood and quantified locally where geologists can interpret the processes taking place in their region of interest.
More information
We thank the IPCC projection authors for developing and making the sea-level rise projections available, multiple funding agencies for supporting the development of the projections, and the NASA Sea Level Change Team for developing and hosting the IPCC AR6 Sea Level Projection Tool. Further details available here:
Fox-Kemper, B., H.T. Hewitt, C. Xiao, G. Aðalgeirsdóttir, S.S. Drijfhout, T.L. Edwards, N.R. Golledge, M. Hemer, R.E. Kopp, G. Krinner, A. Mix, D. Notz, S. Nowicki, I.S. Nurhati, L. Ruiz, J.-B. Sallée, A.B.A. Slangen, and Y. Yu, 2021: Ocean, Cryosphere and Sea Level Change. In Climate Change 2021: The Physical Science Basis. Contribution of Working Group I to the Sixth Assessment Report of the Intergovernmental Panel on Climate Change [Masson-Delmotte, V., P. Zhai, A. Pirani, S.L. Connors, C. Péan, S. Berger, N. Caud, Y. Chen, L. Goldfarb, M.I. Gomis, M. Huang, K. Leitzell, E. Lonnoy, J.B.R. Matthews, T.K. Maycock, T. Waterfield, O. Yelekçi, R. Yu, and B. Zhou (eds.)]. Cambridge University Press, Cambridge, United Kingdom and New York, NY, USA, pp. 1211–1362, doi:10.1017/9781009157896.011.
Kopp, R. E., Garner, G. G., Hermans, T. H. J., Jha, S., Kumar, P., Reedy, A., Slangen, A. B. A., Turilli, M., Edwards, T. L., Gregory, J. M., Koubbe, G., Levermann, A., Merzky, A., Nowicki, S., Palmer, M. D., & Smith, C. (2023). The Framework for Assessing Changes To Sea-Level (FACTS) v1.0: A platform for characterizing parametric and structural uncertainty in future global, relative, and extreme sea-level change. Geoscientific Model Development, 16, 7461–7489. https://doi.org/10.5194/gmd-16-7461-2023
Garner, G. G., T. Hermans, R. E. Kopp, A. B. A. Slangen, T. L. Edwards, A. Levermann, S. Nowikci, M. D. Palmer, C. Smith, B. Fox-Kemper, H. T. Hewitt, C. Xiao, G. Aðalgeirsdóttir, S. S. Drijfhout, T. L. Edwards, N. R. Golledge, M. Hemer, G. Krinner, A. Mix, D. Notz, S. Nowicki, I. S. Nurhati, L. Ruiz, J-B. Sallée, Y. Yu, L. Hua, T. Palmer, B. Pearson, 2021. IPCC AR6 Sea Level Projections. Version 20210809. Dataset accessed [YYYY-MM-DD] at https://doi.org/10.5281/zenodo.5914709.